Market Outlook
January 11, 2018
Market Cues
Domestic Indices
Chg (%)
(Pts)
(Close)
Indian markets are likely to open negative tracking global indices and SGX Nifty.
BSE Sensex
(0.0)
(10)
34,433
US stocks regained ground over the course of the trading day. The major averages
Nifty
(0.0)
(5)
10,632
climbed well off their worst levels of the day but still closed in negative territory. The
Mid Cap
(0.3)
(56)
18,118
Dow Jones dipped to 0.1% to close at 25,369 and the Nasdaq Composite edged
Small Cap
(0.0)
(8)
19,903
down to 0.1%, to 7,154.
Bankex
(0.3)
(91)
28,959
U.K. shares were little changed after the Quarterly Economic Survey published by the
British
Chambers of Commerce showed that the growth in the
Global Indices
Chg (%)
(Pts)
(Close)
U.K. economy remained subdued at the end of 2017. The FTSE 100 was up by 0.2%
Dow Jones
(0.1)
(17)
25,369
to close at 7,749.
Nasdaq
(0.1)
(10)
7,154
On domestic front, Indian shares ended a range-bound session little changed as
FTSE
0.2
17
7,749
investors awaited cues from the Q3 earnings season and next month's Union
Nikkei
(0.3)
(82)
23,706
Budget. The Sensex ended on a downside front of 0.03% at 34,443 while the Nifty
Hang Seng
(0.1)
(44)
31,030
ended at 10,632 with a downside of 0.05%.
Shanghai Com
(0.1)
(4)
3,418
News Analysis
Advances / Declines
BSE
NSE
Result preview: TCS (CMP: `2,807/ TP: `2,442/ Downside: 13%)
Advances
1,305
722
Detailed analysis on Pg2
Declines
1,642
1,071
Investor’s Ready Reckoner
Unchanged
126
56
Key Domestic & Global Indicators
Stock Watch: Latest investment recommendations on 150+ stocks
Volumes (` Cr)
Refer Pg5 onwards
BSE
5,026
NSE
36,399
Top Picks
CMP
Target
Upside
Company
Sector
Rating
(`)
(`)
(%)
Net Inflows (` Cr)
Net
Mtd
Ytd
Blue Star
Capital Goods Accumulate
803
867
8.0
FII
(22)
2,555
2,555
Dewan Housing Finance
Financials
Buy
616
712
15.6
Asian Granito
Other
Accumulate
598
639
6.9
*MFs
2,50,51
2,50,075 2,50,075
Navkar Corporation
Other
Buy
205
265
29.4
KEI Industries
Capital Goods
Buy
375
436
16.4
Top Gainers
Price (`)
Chg (%)
More Top Picks on Pg4
Aban
251
14.8
Key Upcoming Events
Tatasponge
1,198
12.0
Previous
Consensus
Date
Region
Event Description
Geship
465
9.5
Reading
Expectations
Hfcl
35
7.5
Jan11
US
Producer Price Index (mom)
1.40
Jan11
US
Initial Jobless claims
250.00
245.00
Strtech
361
7.2
Jan12
China
Exports YoY%
12.30
10.80
Jan12
India
Imports YoY%
19.60
Top Losers
Price (`)
Chg (%)
Jan12
US
Consumer price index (mom)
0.40
0.10
More Events on Pg7
Rtnpower
7
(5.4)
Pageind
22,970
(5.1)
Videoind
25
(4.9)
Get&D
432
(3.6)
Muthootfin
455
(3.4)
As on January 10 2018
Market Outlook
January 11, 2018
News Analysis
Result preview: TCS (CMP: `2,807/ TP: `2,442/ Downside: 13%)
TCS slated to announce its 3QFY2018 results today. We expect the company to
post 1.3% sequential growth in USD revenues to US$4,801mn. In rupee terms,
revenues are expected to come in at `31,049cr, up 1.7% QoQ. EBITDA margin is
expected to show a downtick of ~16bp QoQ to 26.6%. Consequently, PAT is
expected to be at `6,509cr, up of 0.8% QoQ. We maintain our reduce rating on
the stock, with a price target of `2,442.
Y/E
Sales OPM
PAT
EPS ROE P/E P/BV EV/EBITDA EV/Sales
March
(` cr)
(%)
(` cr)
(`)
(%)
(x)
(x)
(x)
(x)
FY2018E
1,23,384
26.1
26,063
133.2
27.6
21.1
5.8
15.4
4.0
FY2019E
1,34,488
26.1
28,116
143.7
27.8
19.5
5.4
13.9
3.6
Economic and Political News
IFFCO begins free delivery of agri-inputs purchased via digital platform
UIDAI introduces 'Virtual ID' to avoid sharing of your Aadhaar number
India Inc's topline growth to hit 5-year high of 9% in Q3
Country's oil demand growth weakest since 2013 as economy declines
Corporate News
French auto major Groupe PSA partners TCS for its Smart Cars plan
SC asks Jaiprakash Associates to submit details of ongoing housing projects
Maruti Suzuki India hikes prices by up to Rs 17,000 across models
Lupin receives USFDA nod to market Tamiflu capsules to treat influenza
Tata Motors global sales up 23% in December 2017 at 116,677 units
Market Outlook
January 11, 2018
Quarterly Bloomberg Brokers Consensus Estimate
TCS Ltd - Jan 11, 2018
Particulars ( ` cr)
3QFY18E
3QFY17
y-o-y (%)
2QFY18
q-o-q (%)
Sales
31,041
29,735
4.4
30,541
1.6
EBIDTA
8,379
8,229
1.8
8,164
2.6
%
26.9
27.7
26.7
PAT
6,532
6,814
(4.1)
6,460
1.1
IndusInd Bank - Jan 11, 2018
Particulars ( `cr)
3QFY18E
3QFY17
y-o-y (%)
2QFY18
q-o-q (%)
PAT
944
750
25.8
880
7.2
Shree Cement - Jan 11, 2018
Particulars ( ` cr)
3QFY18E
3QFY17
y-o-y (%)
2QFY18
q-o-q (%)
Sales
2,299
1,843
24.7
2,136
7.6
EBIDTA
552
468
17.9
560
(1.4)
%
24.1
25.4
26.2
PAT
258
235
9.8
211
22.2
Market Outlook
January 11, 2018
Top Picks HHHHH
Market Cap
CMP
Target
Upside
Company
Rationale
(` Cr)
(`)
(`)
(%)
Strong growth in domestic business due to its leade`hip
in acute therapeutic segment. Alkem expects to launch
Alkem Laboratories
27,782
2,324
2,341
0.7
more products in USA, which bodes for its international
business.
We expect the company would report strong profitability
Asian Granito
1,799
598
639
6.9
owing to better product mix, higher B2C sales and
amalgamation synergy.
Favorable outlook for the AC industry to augur well for
Cooling products business which is out pacing the
Blue Star
7,695
803
867
8.0
market growth. EMPPAC division's profitability to
improve once operating environment turns around.
With a focus on the low and medium income (LMI)
consumer segment, the company has increased its
Dewan Housing Finance
19,317
616
712
15.6
presence in tier-II & III cities where the growth
opportunity is immense.
Loan growth is likely to pick up after a sluggish FY17.
Lower credit cost will help in strong bottom-line growth.
Karur Vysya Bank
8,872
123
160
30.1
Increasing share of CASA will help in NIM
improvement.
High order book execution in EPC segment, rising B2C
KEI Industries
2,936
375
436
16.4
sales and higher exports to boost the revenues and
profitability
Expected to benefit from the lower capex requirement
Music Broadcast
2,403
421
475
12.8
and 15 year long radio broadcast licensing.
Massive capacity expansion along with rail advantage
Navkar Corporation
3,082
205
265
29.4
at ICD as well CFS augur well for the company
Strong brands and distribution network would boost
Siyaram Silk Mills
3,608
770
813
5.6
growth going ahead. Stock currently trades at an
inexpensive valuation.
Market leadership in Hindi news genre and no.
2
viewership ranking in English news genre, exit from the
TV Today Network
2,684
450
500
11.1
radio business, and anticipated growth in ad spends by
corporate to benefit the stock.
After GST, the company is expected to see higher
volumes along with improving product mix. The Gujarat
Maruti Suzuki
2,83,476
9,384
10,619
13.2
plant will also enable higher operating leverage which
will be margin accretive.
We expect loan book to grow at 24.3% over next two
GIC Housing
2,504
465
655
40.9
year; change in borrowing mix will help in NIM
improvement
We expect CPIL to report net Revenue/PAT CAGR of
~17%/16% over FY2017-20E mainly due to healthy
7,858
354
400
13.1
growth in plywood & lamination business, forayed into
Century Plyboards India
MDF & Particle boards on back of strong brand &
distribution network.
We expect sales/PAT to grow at 13.5%/20% over next
LT Foods
3,318
104
128
23.4
two years on the back of strong distribution network &
addition of new products in portfolio.
We expect sales/PAT to grow at 13%/16% over next two
years on the back of strong healthy demand in writing
Ruchira Papers
459
205
244
19.2
& printing paper and Kraft paper. Further, China had
banned making paper from waste pulp which would
benefit Indian paper companies.
Source: Company, Angel Research
Market Outlook
January 11, 2018
Key Upcoming Events
Result Calendar
D ate
C ompany
January 11, 2018
IndusInd Bank, TCS, Hindustan Me dia Ventures
January 12, 2018
HT Media
Source: Bloomberg, Angel Research
Global economic events release calendar
Bl oomberg Data
D ate
Time
C ountry
Event Description
Unit
Period
L ast Reporte d
E stimate d
Jan 11, 2018
US
Producer Price Index (mom)
% Change
Dec
1.40
7:00 PMUS
Initial Jobless claims
Thousands
Jan 6
250.00
245.00
Jan 12, 2018
China
Exports YoY%
% Change
Dec
12.30
10.80
India
Imports YoY%
% Change
Dec
19.60
7:00 PMUS
Consumer price index (mom)
% Change
Dec
0.40
0.10
Jan 15, 2018
5:30 PMIndia
Industrial Production YoY
% Change
Nov
2.20
4.30
India
Exports YoY%
% Change
Dec
30.60
12: 00 PMIndia
Monthly Wholesale Prices YoY%
% Change
Dec
3.93
4.00
Jan 16, 2018
3:00 PMUK
CPI (YoY)
% Change
Dec
3.10
Jan 17, 2018
3:30 PMEuro Zone Euro-Zone CPI (YoY)
%
Dec F
1.40
7:45 PMUS
Industrial Production
%
Dec
0.20
0.20
Jan 18, 2018
7:00 PMUS
Housi ng Starts
Thousands
Dec
1,297.00
1,270.00
7:00 PMUS
Building permits
Thousands
Dec
1,303.00
1,290.00
7:30 AMChina
Industrial Production (YoY)
% Change
Dec
6.10
6.10
7:30 AMChina
Real GDP (YoY)
% Change
4Q
6.80
6.70
Source: Bloomberg, Angel Research
Market Outlook
January 11, 2018
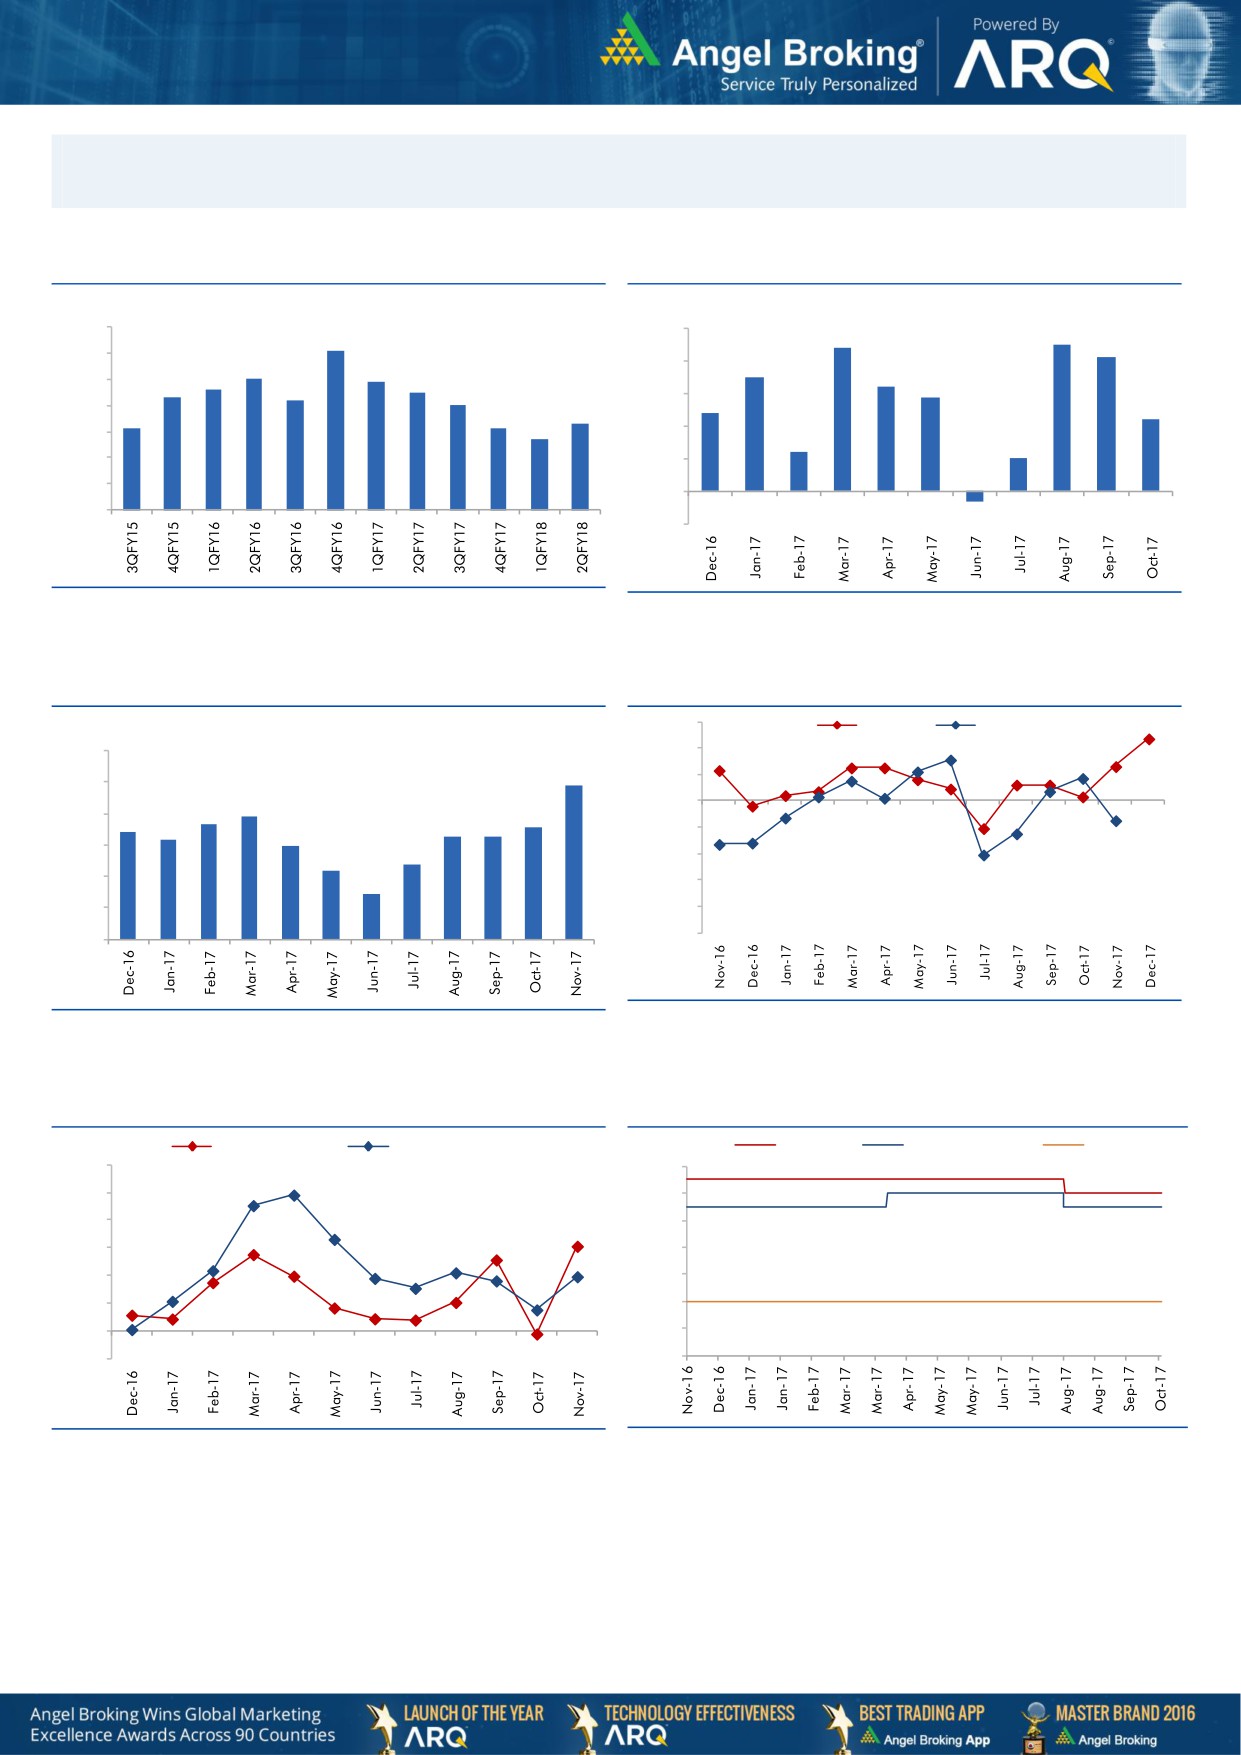
Macro watch
Exhibit 1: Quarterly GDP trends
Exhibit 2: IIP trends
(%)
(%)
10.0
5.0
4.5
9.1
4.4
4.1
9.0
8.0
7.9
4.0
3.5
7.6
7.5
3.2
8.0
7.3
7.2
2.9
7.0
3.0
2.4
7.0
6.3
2.2
6.1
6.1
5.7
2.0
6.0
1.2
1.0
5.0
1.0
4.0
-
3.0
(1.0)
(0.3)
Source: CSO, Angel Research
Source: MOSPI, Angel Research
Exhibit 3: Monthly CPI inflation trends
Exhibit 4: Manufacturing and services PMI
56.0
Mfg. PMI
Services PMI
(%)
6.0
54.0
4.9
52.0
5.0
3.9
50.0
4.0
3.7
3.6
3.4
3.3
3.3
3.2
3.0
48.0
3.0
2.4
2.2
46.0
2.0
1.5
44.0
1.0
42.0
40.0
-
Source: Market, Angel Research; Note: Level above 50 indicates expansion
Source: MOSPI, Angel Research
Exhibit 5: Exports and imports growth trends
Exhibit 6: Key policy rates
(%)
Exports yoy growth
Imports yoy growth
(%)
Repo rate
Reverse Repo rate
CRR
60.0
6.50
50.0
6.00
40.0
5.50
30.0
5.00
20.0
4.50
10.0
4.00
0.0
3.50
(10.0)
3.00
Source: Bloomberg, Angel Research
Source: RBI, Angel Research
Market Outlook
January 11, 2018
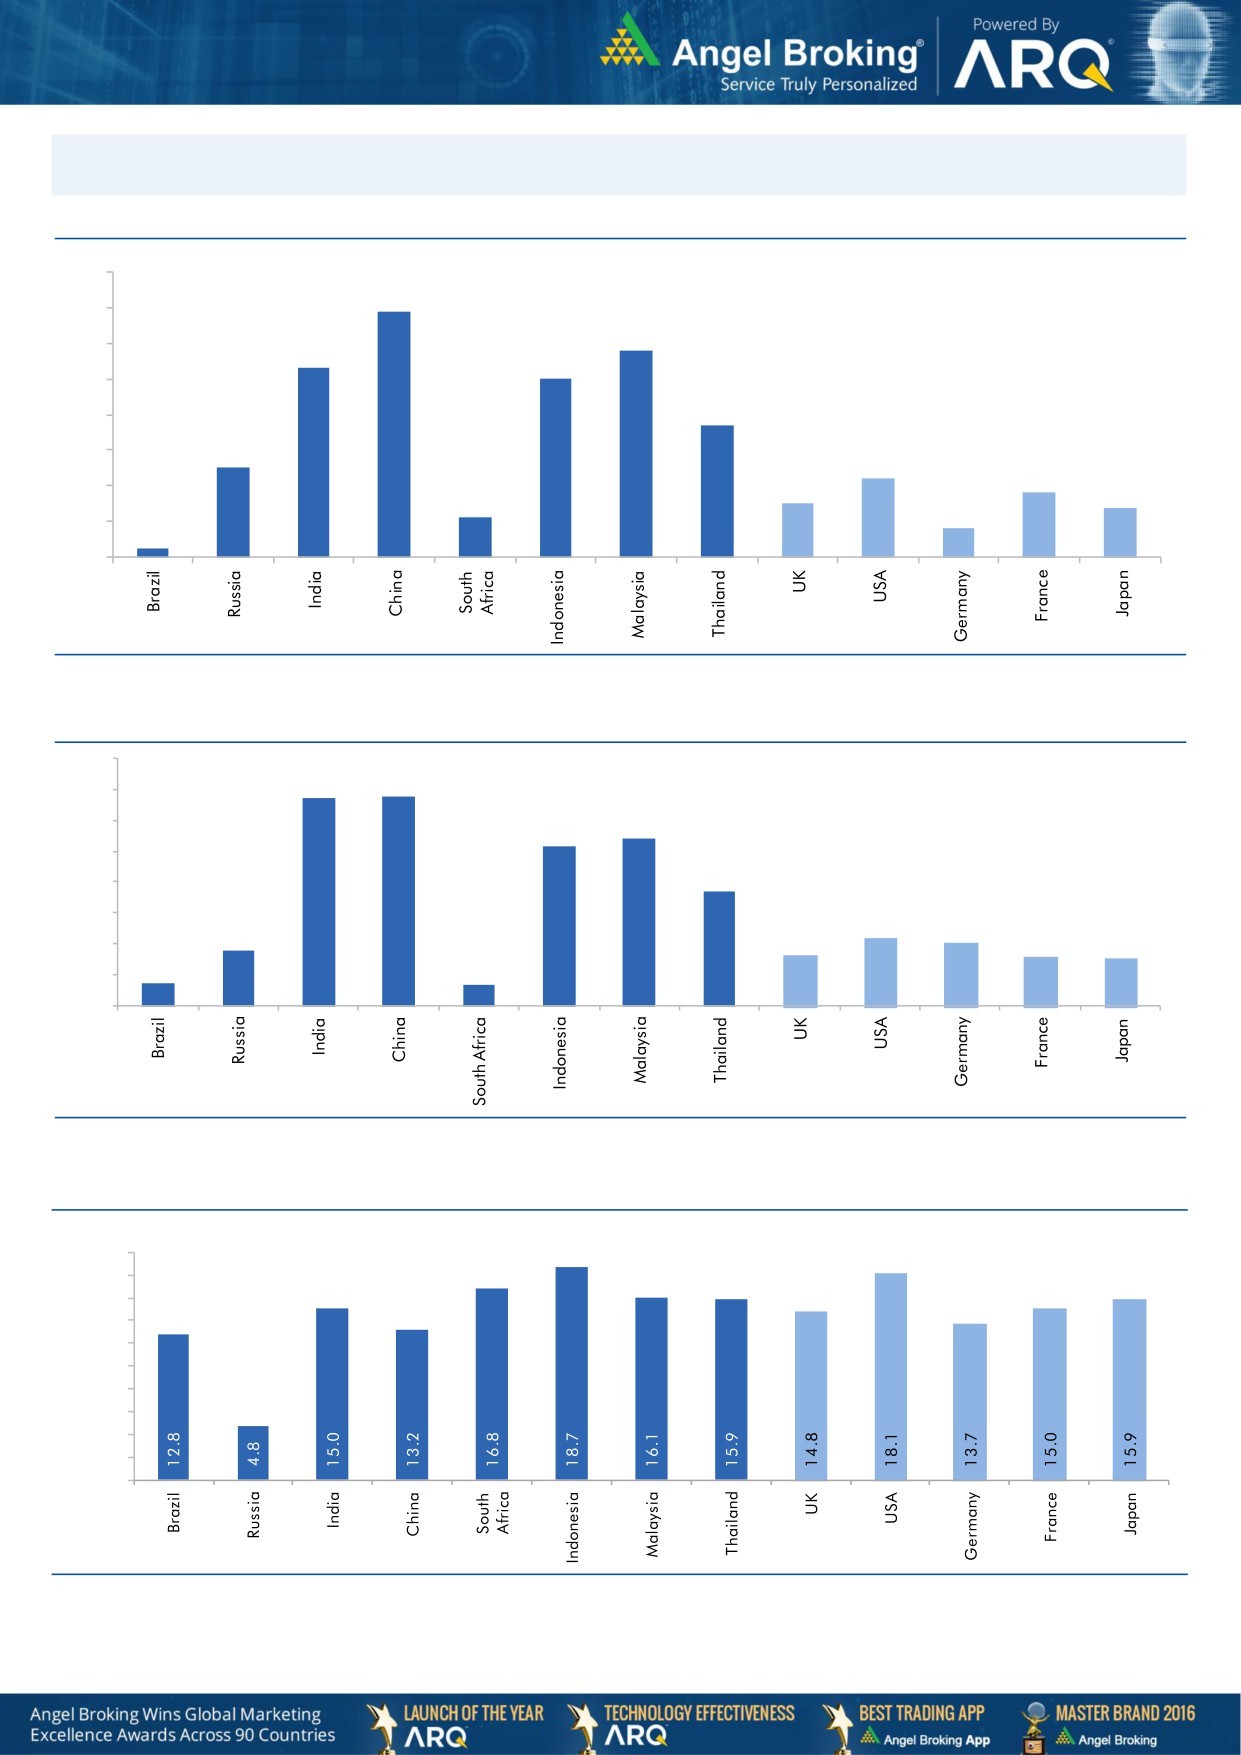
Global watch
Exhibit 1: Latest quarterly GDP Growth (%, yoy) across select developing and developed countries
(%)
8.0
6.9
7.0
5.8
6.0
5.3
5.0
5.0
1.1
3.7
4.0
2.5
3.0
2.2
1.8
2.0
1.5
1.4
0.8
1.0
0.3
-
Source: Bloomberg, Angel Research
Exhibit 2: 2017 GDP Growth projection by IMF (%, yoy) across select developing and developed countries
(%)
6.7
6.8
7.0
6.0
5.4
5.2
5.0
3.7
4.0
3.0
1.8
2.2
2.0
1.7
1.6
2.0
0.7
1.5
0.7
1.0
-
Source: IMF, Angel Research
Exhibit 3: One year forward P-E ratio across select developing and developed countries
(x)
20.0
18.0
16.0
14.0
12.0
10.0
8.0
6.0
4.0
2.0
-
Source: IMF, Angel Research
Market Outlook
January 11, 2018
Exhibit 4: Relative performance of indices across globe
Returns (%)
C ountry
Name of index
Closing price
1M
3M
1YR
Brazil
Bovespa
78,201
6.7
1.9
26.5
Russia
Micex
2,232
5.1
6.6
(0.2)
India
Nifty
10,632
3.6
6.1
29.0
China
Shanghai Composite
3,422
2.9
1.0
9.0
South Africa
Top 40
53,168
3.1
3.6
20.0
Mexico
Mexbol
48,785
3.9
(3.4)
6.3
Indonesia
LQ45
1,082
6.7
9.7
29.8
Malaysia
KLCI
1,823
6.0
3.3
11.0
Thailand
SET 50
1,165
6.8
7.7
21.1
USA
Dow Jones
25,369
4.8
11.5
27.1
UK
FTSE
7,749
5.5
3.2
6.3
Japan
Nikkei
23,788
5.2
15.4
24.5
Germany
DAX
13,281
2.2
2.5
14.0
France
CAC
5,505
2.4
2.6
12.8
Source: Bloomberg, Angel Research p68in4
Market Outlook
January 11, 2018
Research Team Tel: 022 - 39357800
DISCLAIMER
Angel Broking Private Limited (hereinafter referred to as “Angel”) is a registered Member of National Stock Exchange of India
Limited,Bombay Stock Exchange Limited and Metropolitan Stock Exchange Limited. It is also registered as a Depository Participant with
CDSL and Portfolio Manager with SEBI. It also has registration with AMFI as a Mutual Fund Distributor. Angel Broking Private Limited is a
registered entity with SEBI for Research Analyst in terms of SEBI (Research Analyst) Regulations, 2014 vide registration number
INH000000164. Angel or its associates has not been debarred/ suspended by SEBI or any other regulatory authority for accessing
/dealing in securities Market. Angel or its associates/analyst has not received any compensation / managed or
co-managed public offering of securities of the company covered by Analyst during the past twelve months.
This document is solely for the personal information of the recipient, and must not be singularly used as the basis of any investment
decision. Nothing in this document should be construed as investment or financial advice. Each recipient of this document should make
such investigations as they deem necessary to arrive at an independent evaluation of an investment in the securities of the companies
referred to in this document (including the merits and risks involved), and should consult their own advisors to determine the merits and
risks of such an investment.
Reports based on technical and derivative analysis center on studying charts of a stock's price movement, outstanding positions and
trading volume, as opposed to focusing on a company's fundamentals and, as such, may not match with a report on a company's
fundamentals. Investors are advised to refer the Fundamental and Technical Research Reports available on our website to evaluate the
contrary view, if any.
The information in this document has been printed on the basis of publicly available information, internal data and other reliable
sources believed to be true, but we do not represent that it is accurate or complete and it should not be relied on as such, as this
document is for general guidance only. Angel Broking Pvt. Limited or any of its affiliates/ group companies shall not be in any way
responsible for any loss or damage that may arise to any person from any inadvertent error in the information contained in this report.
Angel Broking Pvt. Limited has not independently verified all the information contained within this document. Accordingly, we cannot
testify, nor make any representation or warranty, express or implied, to the accuracy, contents or data contained within this document.
While Angel Broking Pvt. Limited endeavors to update on a reasonable basis the information discussed in this material, there may be
regulatory, compliance, or other reasons that prevent us from doing so.
This document is being supplied to you solely for your information, and its contents, information or data may not be reproduced,
redistributed or passed on, directly or indirectly.
Neither Angel Broking Pvt. Limited, nor its directors, employees or affiliates shall be liable for any loss or damage that may arise from
or in connection with the use of this information.